Sales monitoring: monitor the performance of your sales team
This atlas provides you with a comprehensive vision of your business performance throughout Europe. You can monitor the sales and market penetration indicators of all your sales areas in order to pinpoint where you need to take action.
Business performance in Europe
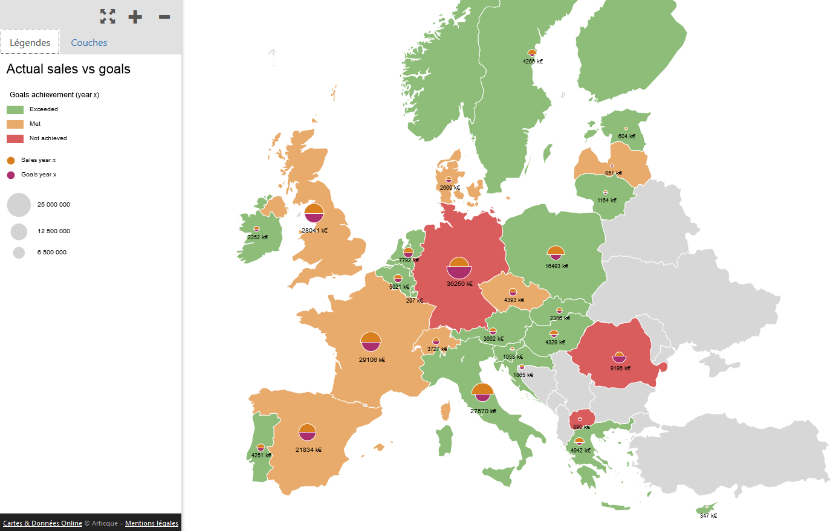
You display actual sales compared to the goals set for each country.
Germany, Romania and Macedonia (displayed in red) have not reached their goals.
Click on Germany to display the exact data of the German commercial sectors.
Sales in Germany
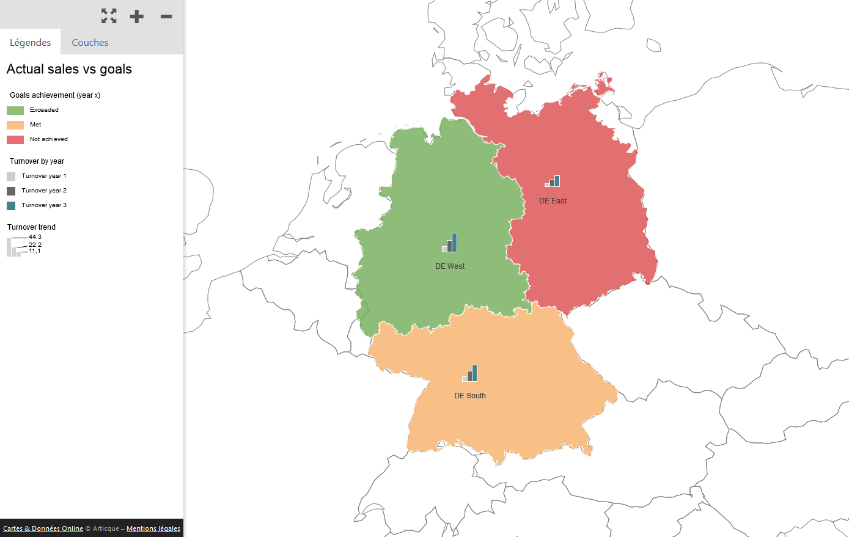
The country is divided into 3 areas: the Eastern area did not achieve its goals.
It is also the area with the lowest yearly turnover.
Click on the Eastern area to access a finer territorial division.
Sales in the Eastern area
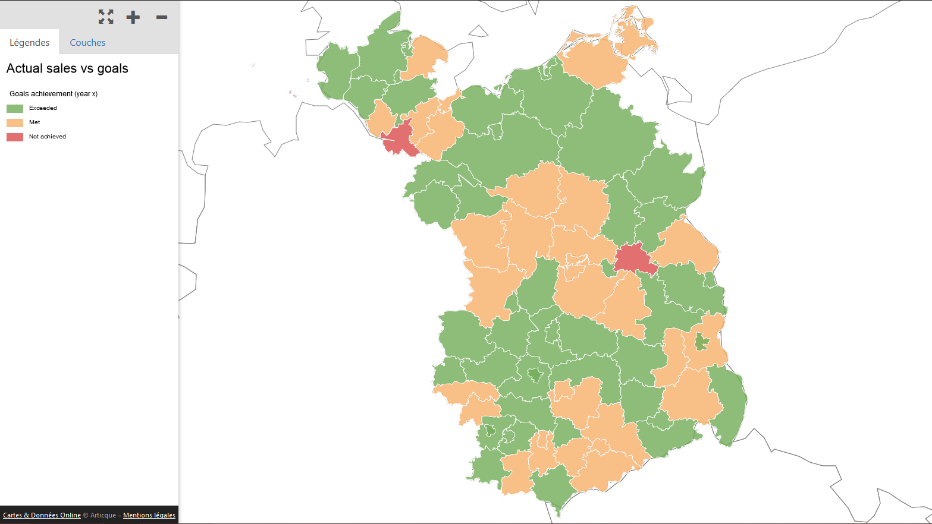
You can see here that the problem originates in two areas corresponding to the two biggest cities in the region: Berlin and Hamburg.
Click on Berlin to display new indicators.
Commercial potential of the Berlin conurbation
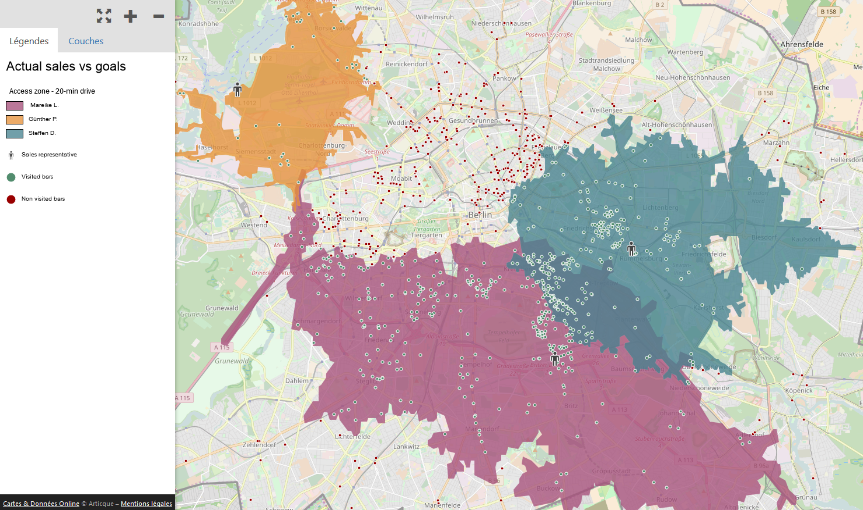
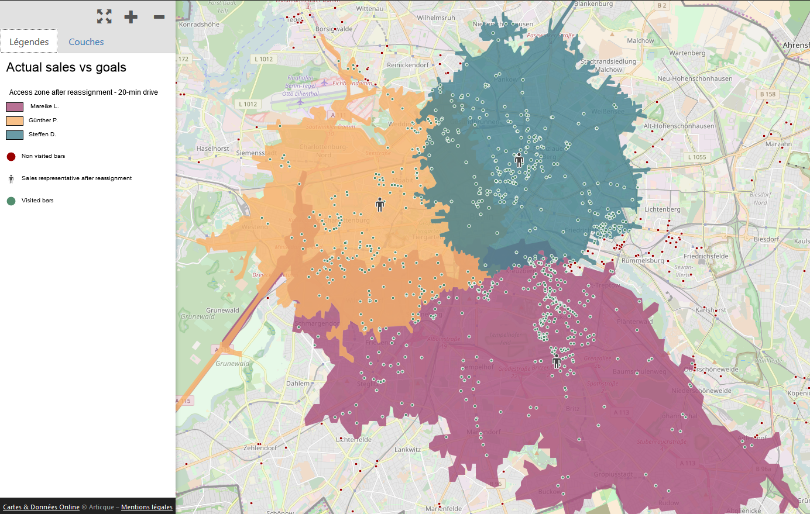
You can display the location of the 3 sales representatives, as well as the area they can access within a 20-minute car drive.
The green dots represent the customers they have already visited, while the red dots represent those who have not been visited yet.
Two problems are immediately evident:
The purple and blue sales representatives are encroaching on part of each other’s areas
The orange sales representative is located in an area which contains few customers, which leaves a lot of uncovered customers on the right.
Click on the Layers tab and select the location of bars and sales representatives after reassignment.
Commercial potential of the Berlin conurbation after the reassignment of the sales team
By reassigning the sales representatives, one can see that the majority of bars are now covered by the network and that sales areas are much more balanced.
As a consequence, reorganizing the areas would fix the identified performance problem.

