The 7.0.8679 version introduces the following features:
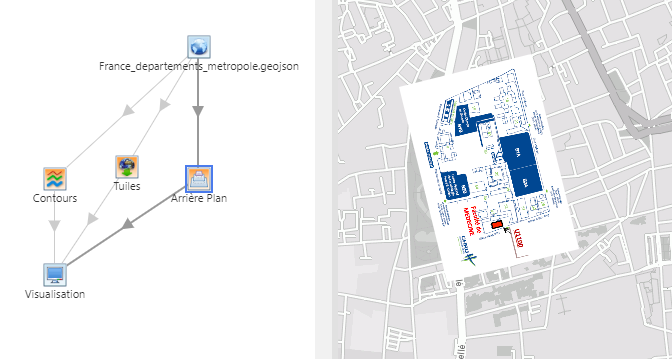
Raster module: uploading and aligning an image
- The Raster module of the flowchart now allows users to upload and distort an image (rotation/enlargement/reduction) so as to align it geographically.
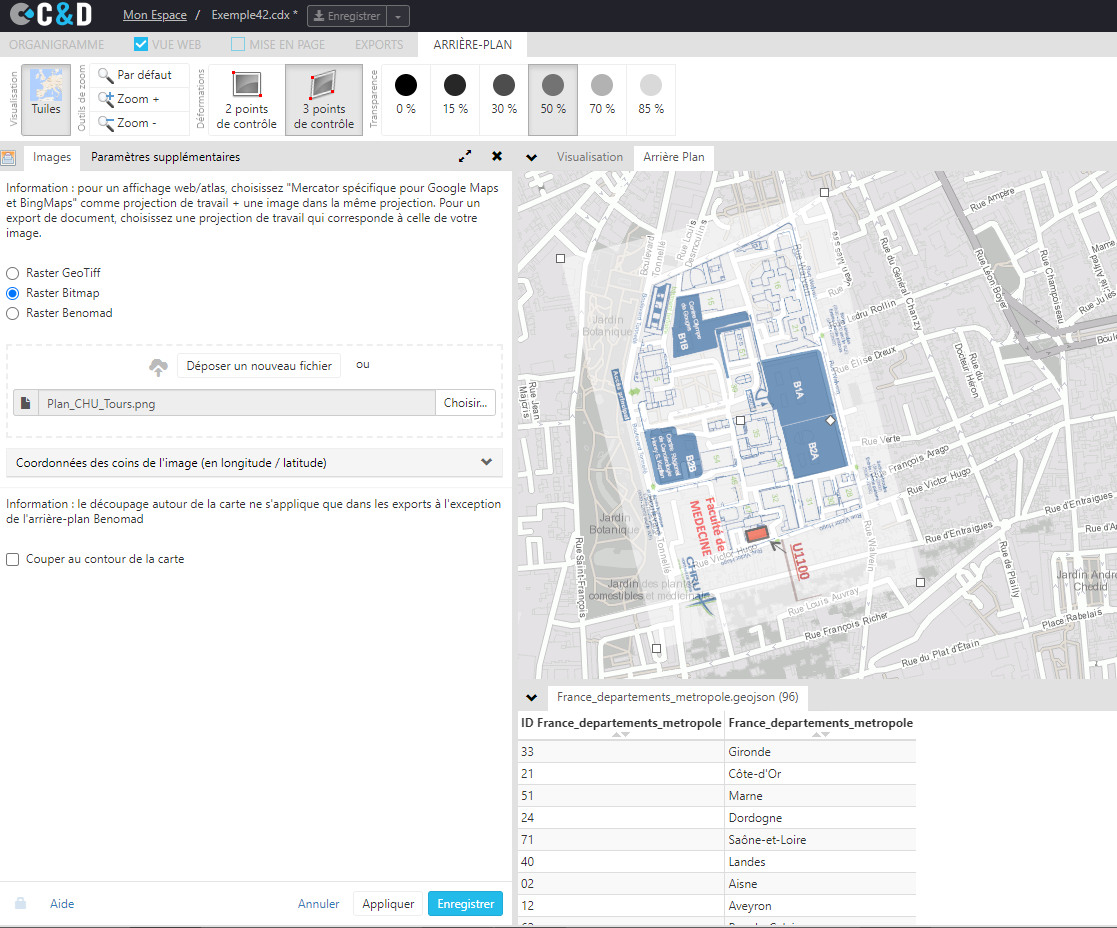
- Users can set the transparency level of an image to better see its geographic context.
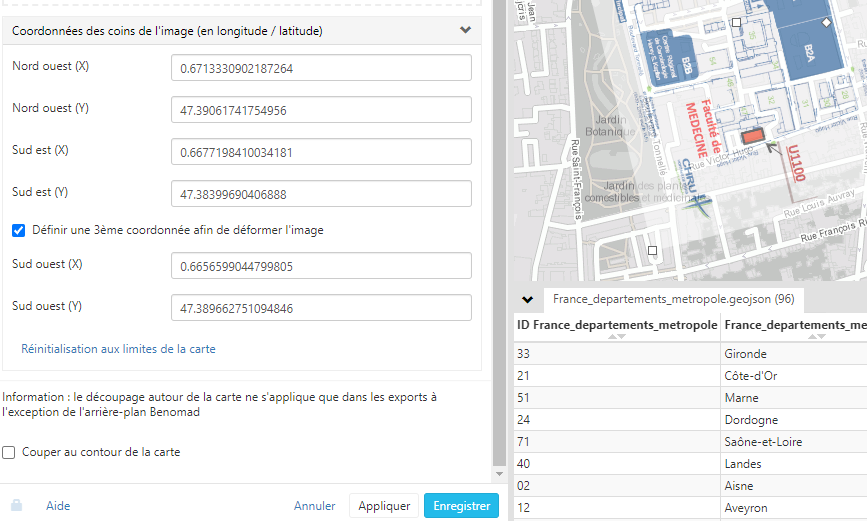
- Two types of distortion are available: simple distortion (following two points) or advanced distortion (following 3 points)
- Users can set the geographic position (latitude/longitude) of the image corners with precision:
- The uploaded image can be displayed as a layer of the final map by linking the Raster module to the Visualization module.
Cutom map module: displaying the representations of the flowchart
- The Custom map module of the Flowchart can now display, in the interface used to draw points, lines and polygons, the representations of a Flowchart.
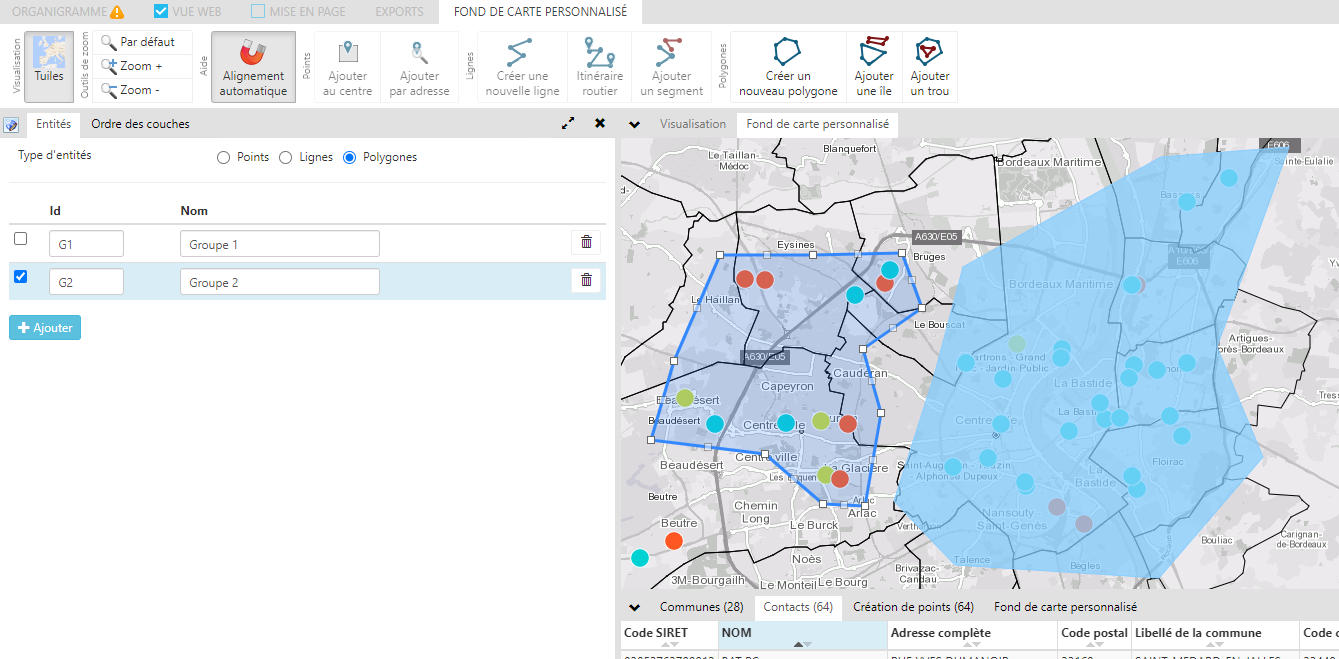
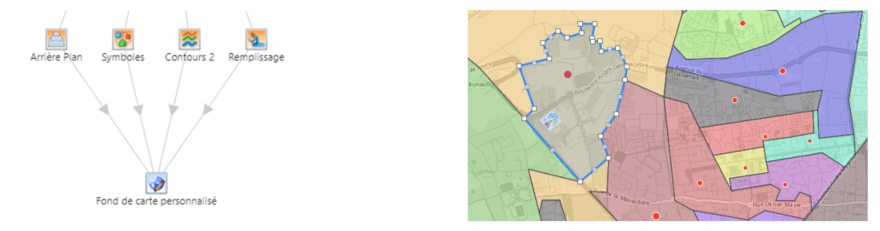
- It is now possible to display all the representations of the flowchart and to draw objects in the Custom map module based on those representations: symbols, strokes, filling…
Other new features of the Custom map module
The Custom map module now has new features* to give users even more possibilities for creating their own base maps:
- The module now accepts representation modules as input (such as the manual districting module, for example)
- It is possible to display, hide and reorganize layers
- Magnetization of displayed layers: this option is useful to draw and align the points, lines and polygons on existing geometries (municipalities, etc.)
* Some of those features were originally offered in our DIGIT GeoService only: they are now fully integrated in the interface and flowchart of Articque Platform to make the work of users even easier.
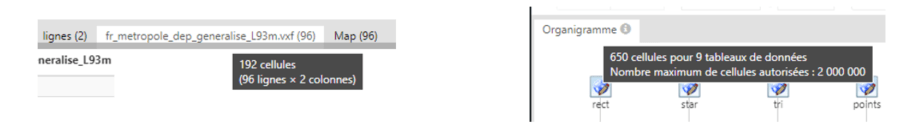
Number of cells within a flowchart
- The total number of cells uploaded to a flowchart is now clearly displayed, on the Flowchart tab or on the tabs of Dataspaces.