Spot phenomena that remain invisible in Excel spreadsheets
Take into account local specificities when making decisions
Anticipate facts thanks to predictive analysis
The SNCF group offers a comprehensive range of mobility solutions through its 6 business lines:
- SNCF Réseau, which manages and develops the French railway network,
- Long-distance mobilities,
- Commuter mobilities,
- SNCF Gares & Connexions, which focuses on improving the stations of the rail network,
- Logistics,
- SNCF Immobilier, which manages Group properties.
Its objective it to give everybody freedom of movement while protecting the planet. After changing its intelligence and HR data analysis system, the group looked for a Business Intelligence solution which included mapping representations and chose Qlik.
The medical department of the SNCF group was already using Articque solutions at the time. When the group reached the technical limits of the maps natively offered by Qlik, the Department of Industrial Digital Expertise quickly turned to Articque.
Thanks to Articque MAP (the mapping extension for Qlik), the SNCF group has a large choice of mapping representations at its disposal and displays its data on its own geographic breakdowns.
Hervé Genty, Deputy Director at the Department of Industrial Digital Expertise and Innovation, presents 2 examples of geographic applications:
- A representation of Railway Safety data: location of events, teams coordination, risk reduction thanks to predictive analysis…
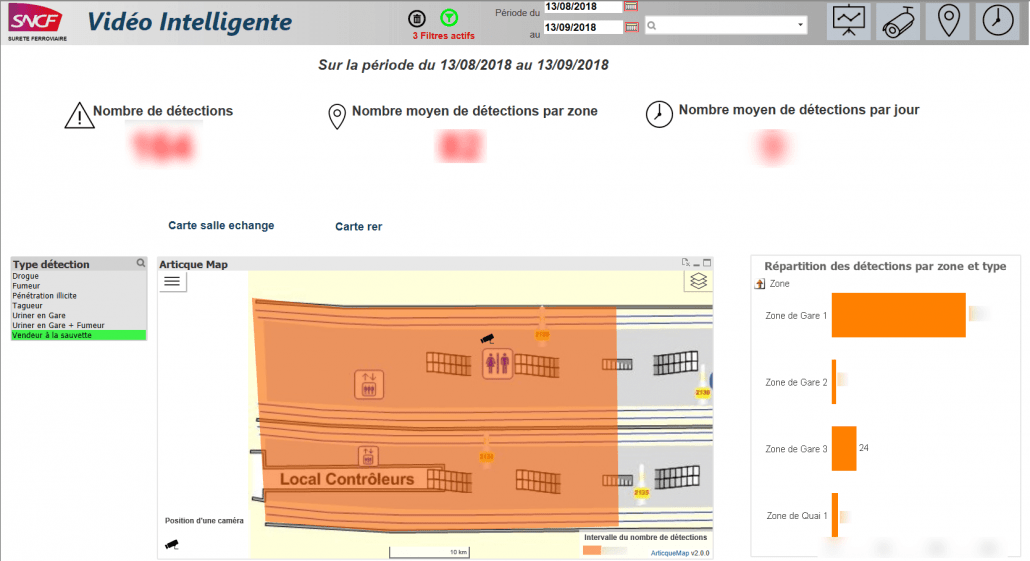
- The mapping of train platforms and the location of events managed by Safety Officers.
« We quickly reached the limits of the cartographic possibilities offered by Qlik. Articque presented us with their Articque MAP extension, which already did substantially better than what market leaders offered »
« We quickly reached the limits of the cartographic possibilities offered by Qlik. Articque presented us with their Articque MAP extension, which already did substantially better than what market leaders offered »
Save time when analyzing data thanks to statistical mapping
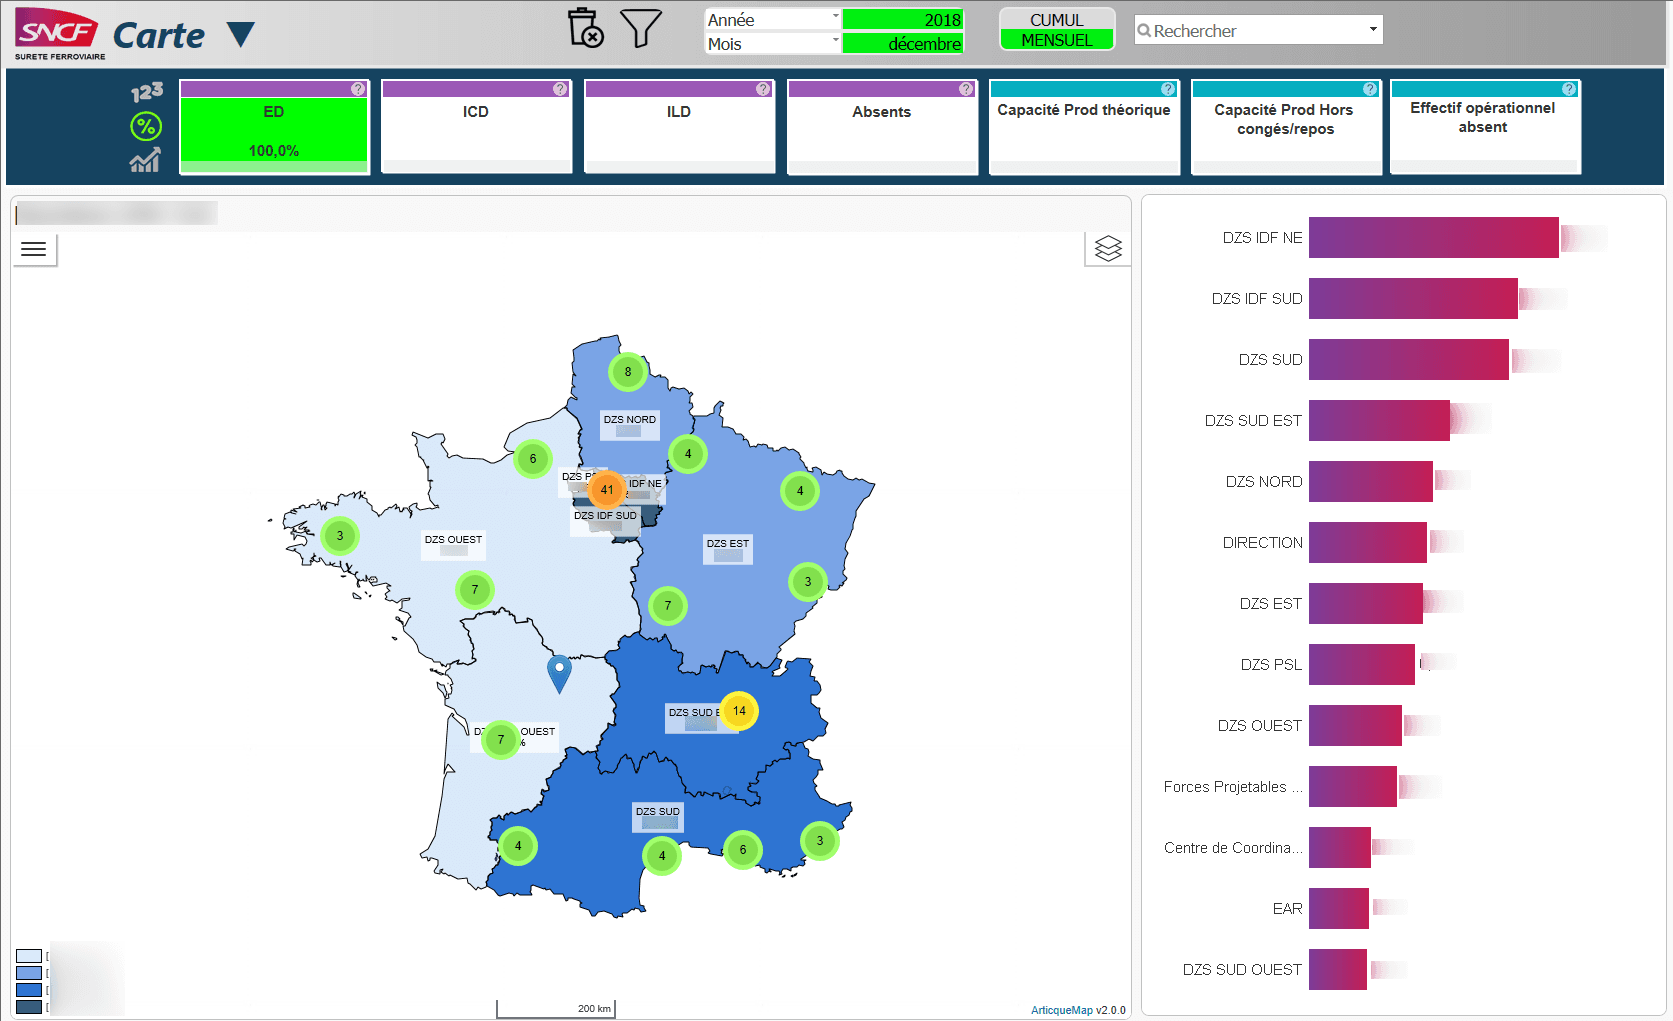
Before they started using Articque MAP, the teams cross-referenced and analyzed thousands of Excel files derived from the activity of the Safety Office. Now the department locates its officers on maps and displays the data regarding their interventions (intrusions, safety checks, surveillance, security, abandoned luggages, thefts…).
When something happens, the department can identify at a glance which team should be sent, depending on the location.
Map of personnel (fictitious data)
« Maps become objects with which we can play and interact, to spot new elements. They blend seamlessly with our pre-existing business Intelligence ecosystem and offer a new, original visualization »
« Maps become objects with which we can play and interact, to spot new elements. They blend seamlessly with our pre-existing business Intelligence ecosystem and offer a new, original visualization »
From the analysis of indicators to predictive analysis
Map of the platforms of a train station
Today, the collection and confrontation of Safety data allows the SNCF group to coordinate its agents in the optimal way: where is my team located? Where should I send it? In which district, or on which platform? For what kind of intervention?
Maps allow the group to clearly observe cyclical phenomena and predict their occurrence, while this information would be lost in data tables, which are difficult to analyze.
« Cartography has a prominent place for operational, decisional and predictive purposes »
« Cartography has a prominent place for operational, decisional and predictive purposes »
The teams quickly adopted cartography
Statistical mapping is at the center of the Information System and is conveyed to the Executive Committee. The simplicity of the tool immediately won over the people involved. Maps have the power to facilitate communication, to make data easier to understand and the decision-making process simpler.

« It’s a beautiful story. Meeting companies and growing with them is a rare thing. We created a beautiful partnership, and what we built together is remarkable. Today, our teams are satisfied and are happy to use maps. »


